Background
Industrial manufacturing equipment equipped with large numbers of sensors is commonplace in today’s modern manufacturing systems. From Smart Factories using AI and digital twins, along with the proliferation of the Internet of Things (IoT) to improve efficiency and productivity, one common challenge is what to do with the vast amounts of equipment sensor data being generated.
Semiconductor manufacturing processes greatly contribute to this data deluge, as the industry continues to drive towards ever smaller dimensions of produced features, moving the entire industry into the “Angstrom Era”. Advancements in semiconductor technology have been enabled by extremely tight control and consistent execution of the underlying manufacturing processes. This requires near perfect functioning of the underlying manufacturing equipment and changes in its behavior must be promptly recognized and localized, with variations in product quality caught and potentially corrected as they are generated.
Consequently, today’s semiconductor equipment comes equipped with numerous sensors, with key machines easily having hundreds of sensors, each of which is densely sampled over time, leading to terabytes of data being generated each day from just vacuum tools in a fab. These data contain useful information regarding various aspects of manufacturing and can be used for multiple purposes, including tool matching, process control, equipment monitoring, virtual metrology and so on.
Integral to any data mining application is conversion of raw sensory data into informative features useful for a specific application during the manufacturing process. Given the number of different tools in a fab and the vast number of possible uses of those data (some of which we may not even know today), the traditional application-specific and situation-specific approach to this step is not sustainable. Approaching such large amounts of data and curating them each time some new data mining application, or a new operating situation is encountered (new process, new machine, new equipment condition) leads to an ever-lasting chore for large numbers of highly trained data scientists perpetually setting and maintaining increasing numbers of machine learning models based on very application- and situation-specific conditions (perpetual whack-a-mole and monitoring of tools which are supposed to help us).
Instead, one needs tools which will automatically curate the data into a form which will enable automatic extraction of informative features and relevant ML models for any given situation, operation, and process of equipment condition—even the ones not seen before or unaccounted for by the process engineers and experts (simply because the number and complexity of machines and processes, those will inherently exist).
UT Austin researchers and this invention addresses this need by enabling users to systematically build better ML and data-mining models, and to do it orders of magnitude faster than what can be done now. High level description of technical details of these capabilities is given below.
Technical description
UT Austin researchers devised a methodology and software, enabling automatic and consistent parsing of all signals coming out of a vacuum tool (etch, deposition) into a sequence of mutually exclusive transient and steady state segments which cover the entire signal. Out of these segments, one can extract physically interpretable, standard features—statistics-inspired features like mean, average, standard deviation etch from steady state segments, and standard transient features like rise time, overshoot, settling times etc., from transient segments.
In essence, we have taken out of the equation the need for “windowing" of signals, which is something commercial, usually expert-driven tools, require (or one needs to do very crude analysis by extracting the aforementioned features from entire signals).
Furthermore, and perhaps more importantly, this methodology and software have removed the need to “baby sit” those signal windows which move, shift, change over long periods of time, even in the same process/same tool. That enables one to plow through terabytes of data every day (e.g., signals from an entire fleet of etch tools in a fab) and continuously analyze all tools, all signals, all the time. No blind spots caused by windowing, no need to babysit the process because e.g., windows “shifted” or some spurious “glitch" occurred in a signal and they surely appear if you look into months of data. The UT Austin tools automatically detects such situations and aligns everything without the need for supervision.
The key to this ability is the use of the formalism of stochastic automata, which facilitates rapid evaluation of likelihoods of any signal parsing and subsequent feature set, based on which adjustments in segment thresholding and alignments are continuously done in a purely automatic way—without the need for human inputs or intervention. Anomalies in this process naturally point to unusual structures in the signals, as well as to their locations in the signals, making process control and crude root cause identification a natural extension of this novel capability (which signal and which segment in that signal showed anomalous behavior).
One should note that for each of the possibly thousands of signals coming out of a single tool, output of what the UT Austin tools do to it is a vector of features which approximates the entire signal (one can approximately reconstruct the signal). Thus, the process can be seen as a compression process that enables the user to mine the data directly in the compressed domain (one does not need to do the usual steps—decompress the data, define appropriate windows and features, and only then do mining—here, all mining happens in the compressed domain). Furthermore, one can organize these compressed data (multiple TB of raw data generated daily by just etch fleet in any given fab) into indexed databases that can be mined much more efficiently than what is being doing today.
Fab data now needs to be organized in temporal lists and with the amounts of data being generated, that absolutely precludes mining the entire fab all the time. Instead, mining is localized to individual tools, limited application scopes and small timescales. With the UT-enabled compression method, one can organize fab data like search engines organize their queries/website entries—and then one can mine the entire fab all the time.
More quantitatively said, the invention’s capability should enable mining of databases in semiconductor fabs to scale logarithmically rather than linearly, which is what the industry deals with now—which is unsustainable.
All the above enables anyone (tool suppliers, chipmakers, other researchers) to rapidly deploy and evaluate whatever data mining method one wants to try. In essence, these capabilities accelerate development and deployment of data mining and ML tools because data curation (signal processing and extraction of useful features) is done automatically (and is usually the most time-consuming and most error-prone stage of any data mining activity), with data mining taking place directly in the compressed domain, as illustrated in Figure 1. Figure 2 shows raw signals and how they are segmented, aligned using this tool.
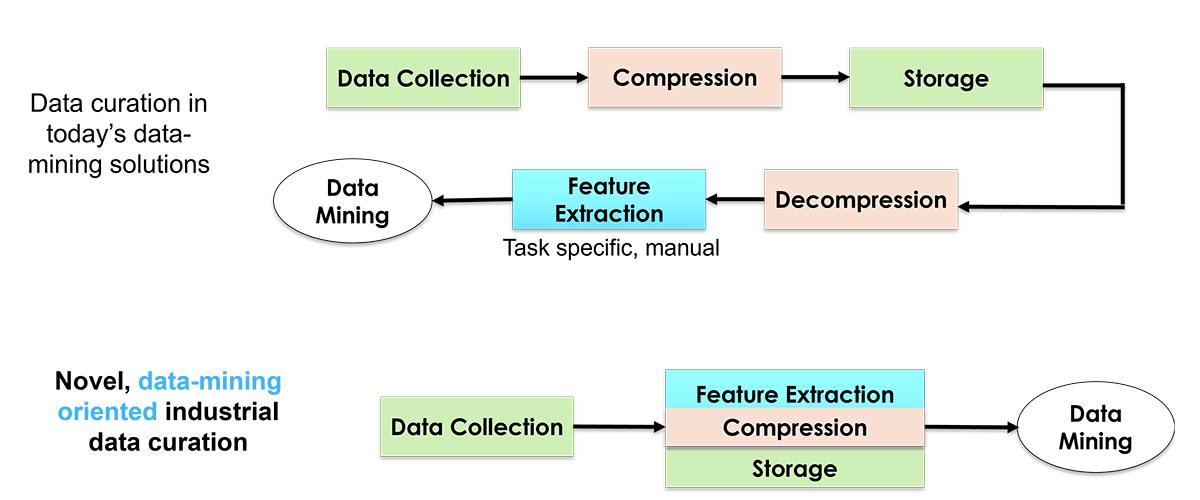
Figure 1: Opportunity for a new paradigm in management and curation of industrial data
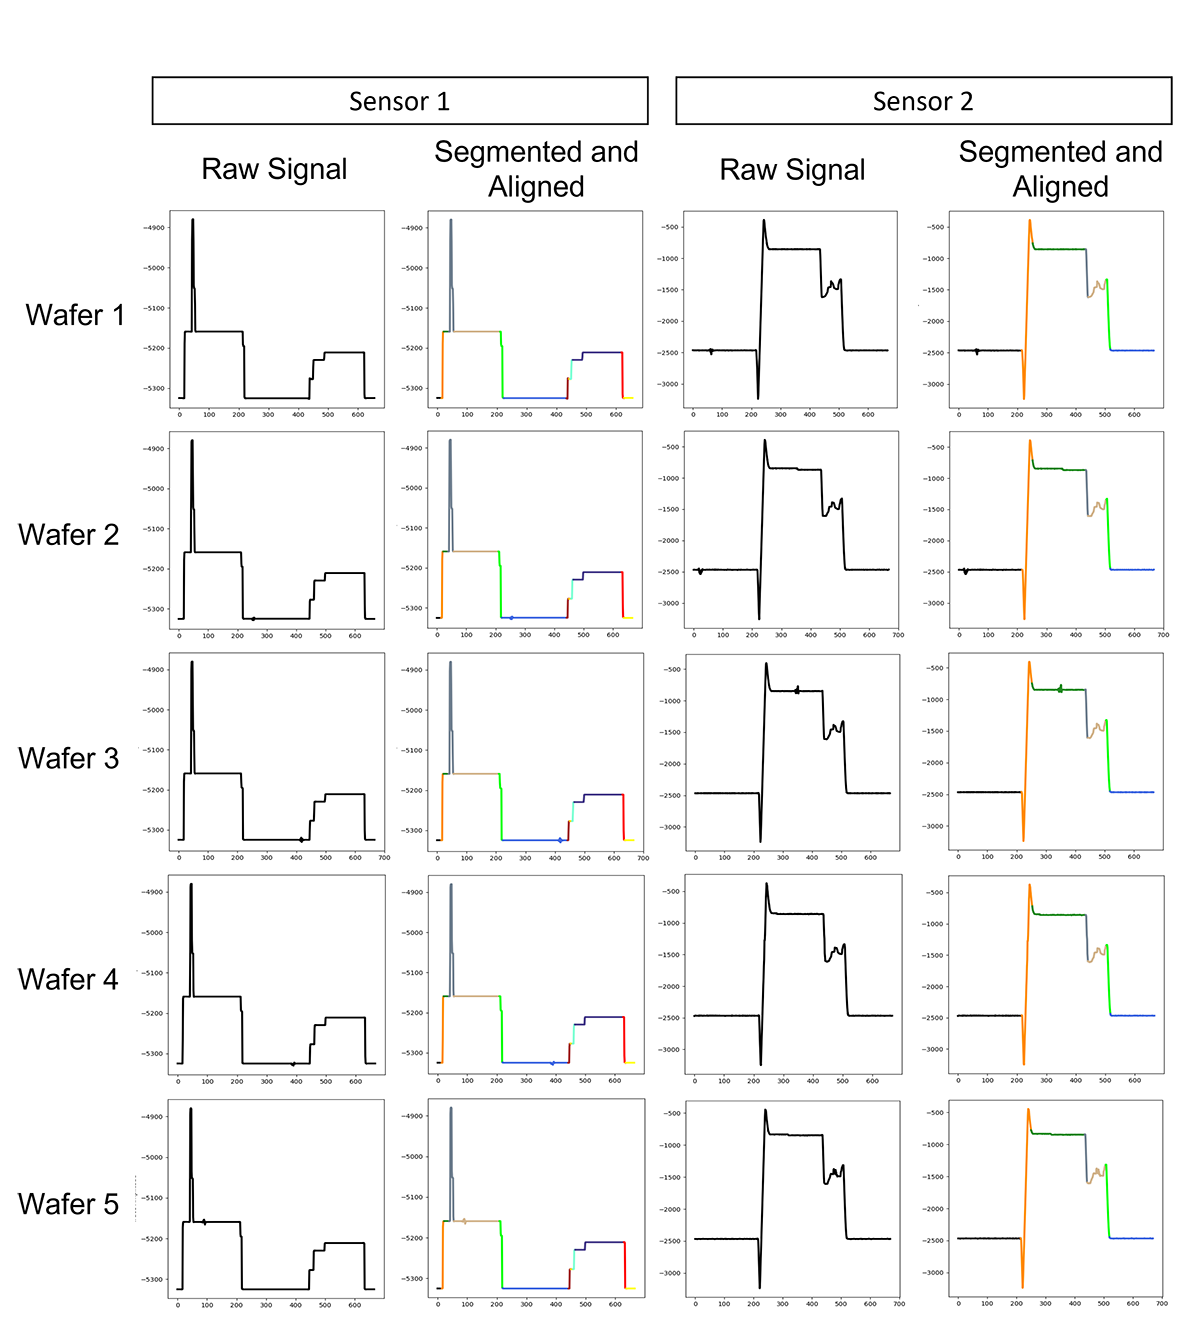
Figure 2: Examples of signals from real-world tool sensor data, before and after segmentation and alignment. Each color represents a segment specified by alignment, that is matched across wafers.
Benefits
- Methodology and software enabling automatic and consistent parsing of all signals coming out of a vacuum tool (etch, deposition) into a sequence of mutually exclusive transient and steady state segments which cover the entire signal.
- Extract physically interpretable, standard, statistics inspired features like mean, average, std. dev etch from steady state segments.
- Extract standard transient features like rise time, overshoot, settling times etc., from transient segments.
- Remove the need for “windowing” of signals and the “babysitting” of those window signals which move, shift, change over long process times, even in the same process/same tool.
- Plow through terabytes of data for continuously analyzing all tools, all signals, all the time.
- Anomalies in this process naturally point to unusual structures in the signals, as well as to their locations in the signals, making process control and crude root cause identification a natural extension of this novel capability (which signal and which segment in that signal showed anomalous behavior).
- Compression process (UT software tool outputs vector of features that approximates the signal) enables user to mine the data directly in the compressed domain. Indexed databases of compressed data can be mined more efficiently, localized to individual tools, limited applications scopes and small, time scales.
- Accelerates the development and deployment of data mining and ML tools as data curation (signal processing and extraction of useful features) is done automatically saving many manhours and days. (See Figure 3 below).
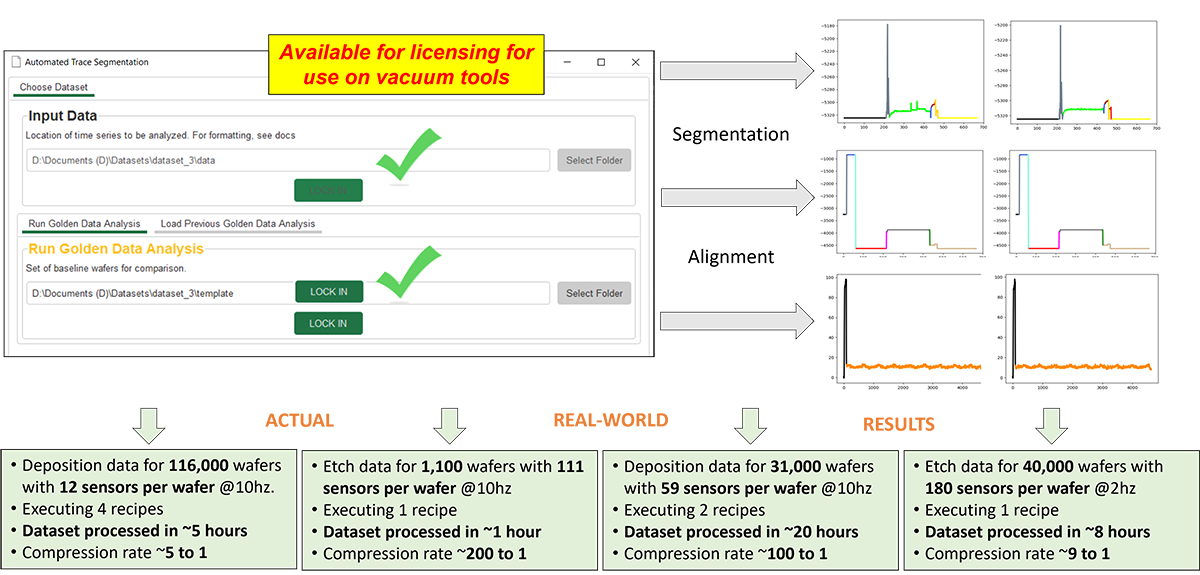
Figure 3: Fully automated dynamics-inspired signal segmentation extraction & alignment of descriptive signal features